Let's Encrypt Uptime - 2 years on
I have looked at the service disruptions of Let's Encrypt back at the end of 2017. Two years on, I had another look - and compared twelve months periods.
Let's Encrypt has been a new service that launched in mid-2016. One would naturally expect that first 12+ months were a bit bumpy as the technology, including the infrastructure, settles in. So I was curious how things changed since.
I used the same source as the first time - https://letsencrypt.status.io. The records seem to be fairly reliable. However, it appears that on several occasions the time of an incident starts when a report is received rather than the time potentially provided by the reporting party. I would not expect that to have a large impact but I wonder if there's a need for an independent uptime monitoring.
A number of incidents are labeled as "partial" without any further information about the scale of the impact - does it mean longer latency but the provided services are still fully available, does it mean that a certain fraction of API calls fail or is the impact limited, e.g., geographically?
The history of the Let's Encrypt status over the last 12 months (20 Nov 2018 to 20 Nov 2019) contains 95 records, from which 77 relate to the production services. I ignore non-core services, e.g., web site.
Planned Upgrades
When you look at the Let's Encrypt status history, you will immediately notice a fairly large number of upgrades. There is in fact 46 Boulder upgrades, which sounds like an incredibly high number.

Planned upgrades of Let's Encrypt production services. Multiple upgrades per month are stacked.
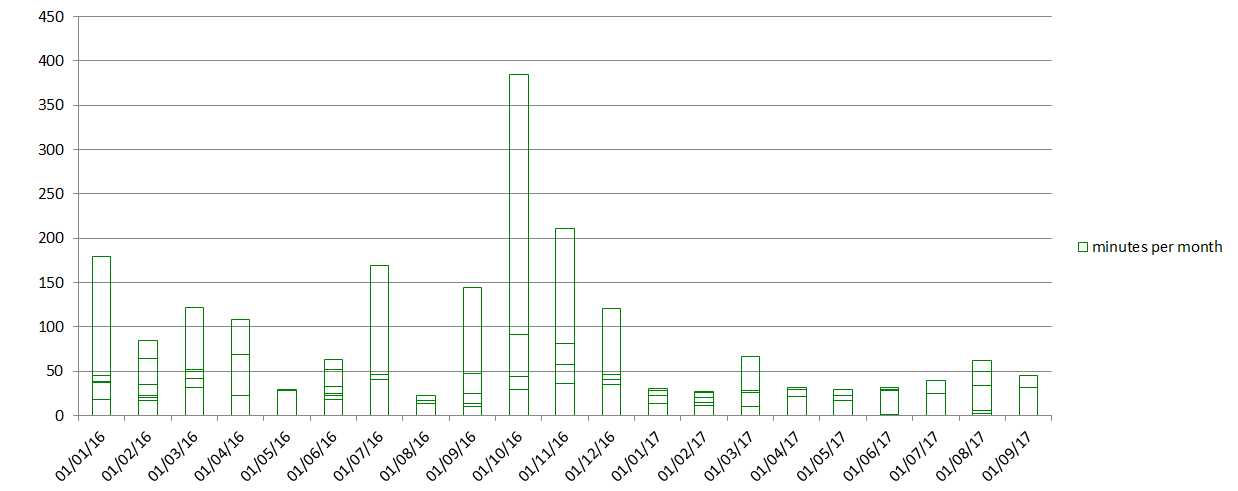
As far as I could see, none of them caused any downtime and my main observation is that while the total number is surprisingly high, the team has certainly mastered the upgrade process and is able to quickly react to potential incidents. Below is a similar graph from 2017. While the number of upgrades is similar, it is clear that the time required for each upgrade as stabilised. Which means much better reliability of upgrades.

Let's Encrypt upgrades in 2017. Multiple upgrades per month are stacked.
Note: the chart above is the only in with linear Y-axis. I used logarithmic axis in the following charts to improve the visibility of short outages in the presence of large outliers.
Full Disruptions
The most important aspect, from users' point of view, is the probability of full service disruptions. This directly impacts the overall reliability of certification services and it is one of the main selling points for commercial CAs. Many of them like to quote their 99.99% or higher uptime.
Let's Encrypt has significantly improved over the last 2 years in terms of the number of incidents. Although it's still quite some distance behind commercial CAs (although they don't publish their incident data).

Full Disruptions in minutes (logarithmic scale).
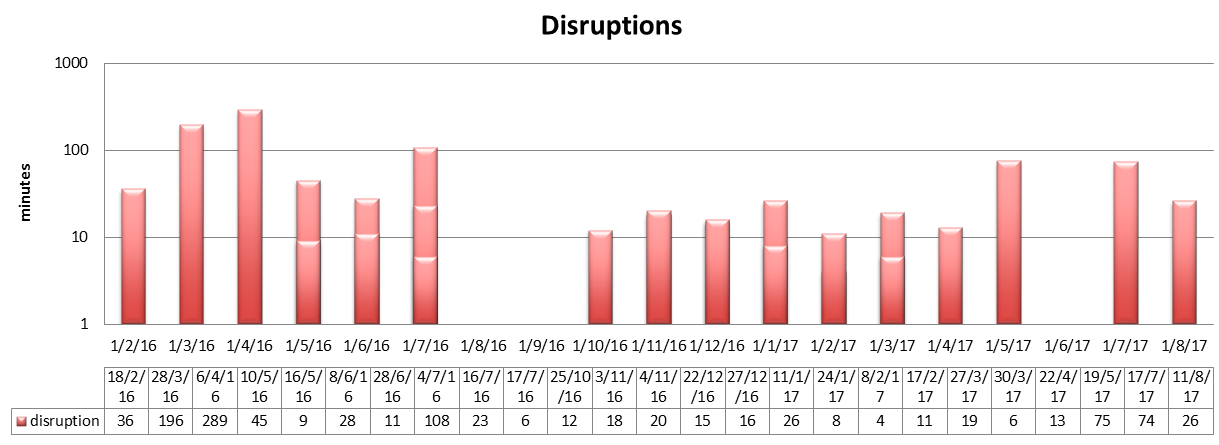
You can see that the length of downtimes is relatively short. These include at least 3 instances of downtime related to maintenance - one infrastructure and two on the application level. The overall uptime in 2019 is 99.92%, which is better than the figure I found in 2017 (99.86 - with 99.9% over the second part of the interval analyzed then) - see below.

Full service disruptions in 2017. Logarithmic scale for the durations.
The 2019 incidents include a couple of issues with OCSP responder. This is a fairly critical part of the LE services as it may result in unavailability of websites if browsers require OCSP validations.
Partial Disruptions
The final part of my comparison is partial disruptions. It is less transparent as the comparison is very blunt and lacks the detail of the impact of particular incidents. Nevertheless, I was somewhat surprised that the downtime was still relatively high.

Partial Disruptions of Let's Encrypt in 2019. Multiple incidents per month are stacked.
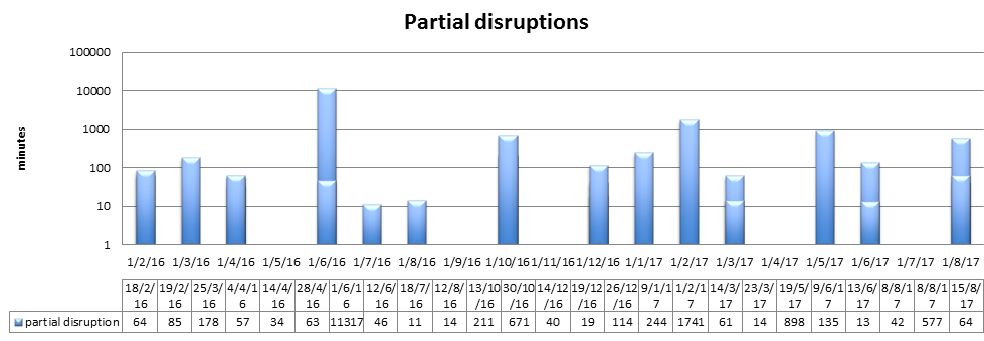
The combined uptime figure (all services fully functional) is only 96.4%, which is lower than what I found in 2017, when the figure stood at 98% (again, the 2017 chart is below).

Partial disruptions of Let's Encrypt in 2017. Y axis is logarithmic.
It's worth mentioning that the 2019 results are significantly affected by a couple of incidents that lasted several days. One of them was caused by a migration to another CDN (details provided by "_az"). If we exclude one of both of these partial outages, the uptime is 97.9% and 99.7% respectively.
OCSP
I have not charted OCSP outages separately for two reasons. Firstly, I can see only two of them (one full, one partial). Secondly, these outages where short - 5 and 7 minutes and it's not clear to me whether they cover the whole outage or whether the measured interval starts only when the LE team started investigating it.
If we assume the logged times are accurate, the overall uptime of OCSP responders would be >99.99%.
A Final Note
Looking at the data and charts above, the main question of mine is whether Let's Encrypt can ever reach the reliability of commercial CAs nor whether LE has such an aspiration.
LE's main feature is automation. While we generally don't mind if a certificate is renewed today or a week later, the relatively low uptime is a concern. Especially as there are no official service level guarantees.
This "exercise" made me also wonder whether it makes sense to implement an uptime monitoring system that would provide an independent uptime data. LE issues around 1.3 million certificates a day so every one minute downtime impacts over 900 certificate requests. Similarly, 1 minute downtime of OCSP responders is significant as 50-60% of websites use Let's Encrypt certificates. Arguably, these websites will not include any of the large one but still.
This analysis was created by Dan Cvrcek, a founder of KeyChest - TLS expiry monitoring service with a global database of all certificates and automation of certificate issuance.
